
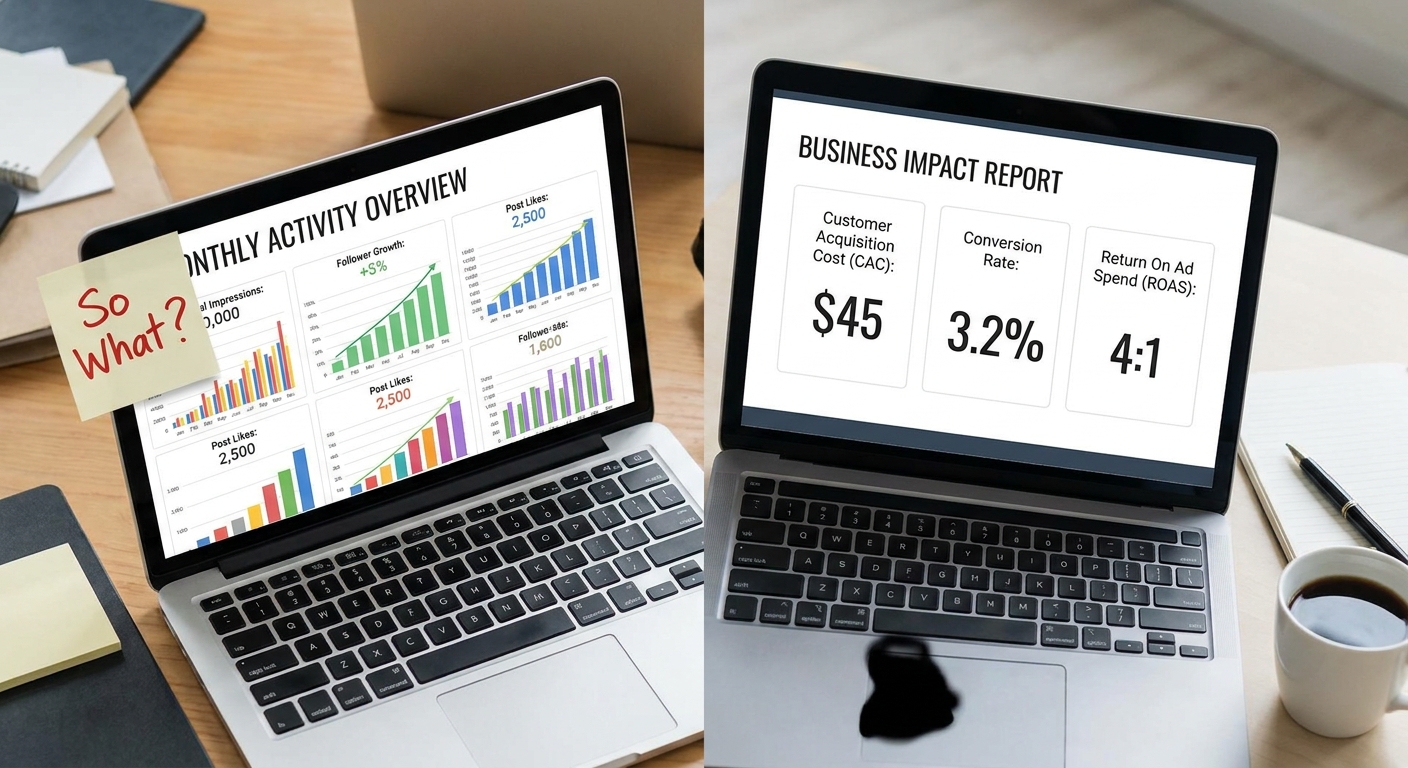
Hello and welcome back to The Busy Business Owner’s Guide to Marketing! It’s so good to have you here for episode 35. Today, we are wading into some deep—but critically important—waters. We’re tackling the question: What should my ‘done-for-you’ partner actually be reporting on, and what’s just digital smoke and mirrors?
I see this scenario play out all the time. You’ve made the smart, strategic decision to delegate your marketing to a pro—an agency or a freelancer. You’re feeling good, you’re freed up to focus on other parts of your business, and then it happens: that monthly report lands in your inbox.
You open it, and it’s a dizzying array of colorful charts, soaring graphs, and big, impressive-sounding numbers. But as you scroll through, a nagging feeling starts to creep in. You’re left scratching your head, wondering, “Okay… but did we make any more money?”
If that feels familiar, you are not alone. This episode is all about empowering you to cut through that noise. We’re going to give you the tools to distinguish between the numbers that actually grow your business and the ones that are just fluff, designed to make you feel good without doing good for your bottom line.
The Allure of Fool’s Gold: Unmasking Vanity Metrics
Alright, let’s dive into these so-called ‘vanity metrics’. I like to think of them as the digital equivalent of fool’s gold. They are shiny, they sparkle under the light, and they feel great to talk about. But when you try to cash them in, you realize they aren’t worth a thing.
We’re talking about metrics like:
- Total social media likes
- Follower counts
- Page views
- Impressions (how many times your ad was shown)
Let me paint a vivid picture for you. I once onboarded a new client who was absolutely thrilled with their previous agency’s report. It proudly displayed that their campaign had generated over 100,000 impressions in a single month! On the surface, that sounds incredible, right? A hundred thousand people saw their brand!
But when we dug just one layer deeper, the story fell apart. Those 100,000 impressions hadn’t led to a single meaningful website click. Not one. Let alone a contact form submission or a sale. It felt good, but it didn’t do anything. The report was a beautiful, hollow shell.
The real problem with vanity metrics is that they lack context and a direct link to a business outcome. A million impressions are worthless if they don’t lead to a single customer. A thousand new followers mean nothing if none of them are in your target market or ever intend to buy from you.
My Secret Weapon: The ‘So What?’ Test
This brings me to a little trick I use with my team and my clients, a simple framework I call the ‘So What?’ Test. It’s painfully simple, but profoundly effective.
Here’s how it works: Whenever your marketing partner presents you with a number, I want you to mentally (or even out loud!) ask, “So what?”
Them: “We got 10,000 likes on our Instagram posts this month!” You: “So what?”
If they can’t immediately give you a clear, compelling answer that links that metric to a tangible business result, you’ve likely found a vanity metric.
A good answer would sound something like, “Those likes generated a 20% increase in post engagement, which led to 500 new website visitors from Instagram, and 5 of those visitors made a purchase.” See the difference? There’s a clear, logical path from the initial metric to a business outcome.
A bad answer, or a red flag, sounds like, “Well… it means people like our brand!” That’s fool’s gold. The ‘So What?’ Test is your best friend for separating the fluff from the real, actionable KPIs that directly impact your revenue.
The KPIs That Actually Grow Your Business
So, if we’re pushing past the fluff, what should we be focusing on? While the specifics can change based on your goals, there are a few heavy hitters that almost always tell a meaningful story about your business’s health.
- Customer Acquisition Cost (CAC): This is the big one. How much, on average, does it cost you in marketing and sales spend to acquire one new paying customer? If you spent $1,000 on ads and got 10 new customers, your CAC is $100. This number is the bedrock of sustainable growth. You need to know it.
- Conversion Rate: This is your marketing’s efficiency score. Of all the people who visited your landing page, what percentage actually filled out the form? Of all the leads you generated, what percentage became paying clients? High conversion rates mean your messaging and offer are resonating perfectly.
- Return On Ad Spend (ROAS): For paid advertising campaigns, this is the ultimate gut check. It’s a simple ratio: for every single dollar you put into ads, how many dollars in revenue did you get back? A 3:1 ROAS means you made $3 for every $1 you spent.
These are the metrics that have consequences. They are directly tied to your cash flow, your profitability, and the long-term health of your business.
My Unbreakable Rule: Match the Metrics to the Mission
Now, this is super important, so I want you to lean in for this. The KPIs that matter most are always, and I mean always, tied to your specific campaign goal. It is absolutely not a one-size-fits-all deal.
My unbreakable rule: Before you look at a single number, re-state the primary goal of the campaign.
Let’s break it down:
- If your goal is Brand Awareness: You’re just trying to get your name out there and build familiarity. In this specific case, metrics like Reach (how many unique people saw your content) and Engagement Rate (what percentage of those people interacted with it) become the North Stars. The goal isn’t immediate sales; it’s to build an audience for the future.
- If your goal is Lead Generation: My focus shifts entirely. Forget the likes; I don’t care about them here. I want to know the Cost Per Lead (CPL) and, crucially, the Quality of Those Leads. I would rather have 10 high-quality leads that cost $50 each than 100 junk leads that cost $5 each.
- If your goal is E-commerce Sales: Now we’re talking. This is where the rubber meets the road. The only things that truly move the needle are your Return On Ad Spend (ROAS), your Average Order Value (AOV), and that all-important Customer Lifetime Value (CLV). This is about pure, measurable return on investment.
See how the “right” metrics change completely based on the mission? A great marketing partner understands this and customizes their reporting to reflect your goals, not their own.
From Data Dump to Business Story: What a Great Report Looks Like
So, what does a truly great report actually look like? It’s less of a list of numbers and more of a story.
A bad report is a data dump. It’s a 10-page PDF of charts and graphs with zero interpretation. It’s lazy, and it puts all the work of figuring it out back on you.
A great report, on the other hand, tells you the story of your marketing. Here’s what I always look for:
- A Plain-English Executive Summary: Right at the top, there should be a paragraph or two explaining what happened, what it means for the business, and the key takeaways. No jargon allowed.
- Connecting Actions to Outcomes: It should never just say, “We posted 10 times on Instagram.” A great partner reports, “Our 10 Instagram posts this month were designed to promote the new product launch. They drove 500 targeted visitors to the product page, which resulted in 5 sales at a Return On Ad Spend of 3-to-1.”
- Insights and Analysis: The report should answer the “why” behind the numbers. “We noticed that our video content outperformed static images by 50% in driving clicks, which tells us our audience is highly responsive to video. We recommend shifting more of our creative budget to video next month.”
- A Clear Plan for Next Steps: A report isn’t just a look back; it’s a roadmap for the future. Based on what we learned, what are we going to do next month to improve? That’s what turns data into progress.
It’s Time to Take Back Control
To wrap things up, the big takeaway is this: you are paying for business results, not just marketing activity. Demand reports that tell a business story, not just a data story.
Don’t be afraid to push back on the fluff and apply the ‘So What?’ Test. A great partner will welcome your questions because it shows you’re engaged. Focus on understanding your Customer Acquisition Cost, your conversion rates, and your return on investment—that’s what truly tells you if your marketing is working.
I’d really encourage you to have an open, honest chat with your marketing partner to align on these critical KPIs. It will transform your relationship and, more importantly, your results.
That’s all we have time for today! I hope this helps you feel more confident and in control when that next report hits your inbox.
Join us next week as we tackle a powerful strategy for making every penny count, in our next episode titled: ‘Paid Ads on a Small Budget: The Tripwire Funnel Explained’. You won’t want to miss it.
As always, I’d love to hear from you. What’s the most confusing metric you’ve ever seen in a report? Drop a comment below and let’s talk about it!